In our last post, we wrote that when it comes to data, more isn’t always better. Not all data is created equal. The same can be said about metrics – not all metrics are created equal. Being able to point out these misleading metrics and learning how to read what the data is telling you is vital to making strategic decisions.
A brief history of Google Analytics
In 2005, Google launched its analytics platform, giving webmasters the ability to see how users were interacting on their website. By August 2006, Google Analytics was fully available to all users. Over the years, Google has evolved the platform to include real-time data, cross-platform tracking, custom dimensions, and custom metrics.
Today, GA is found on an estimated 55% of all websites. It’s undoubtedly a vital tool for digital marketers to measure and improve. But among all of this usefulness, there are some metrics that create dissonance in our reporting.
Is Bounce Rate A Measure of Performance?
Bounce Rate is not a valuable metric for gauging your website performance. As marketers, we want our data to tell us if things are good or bad. More revenue is good. Fewer registrations are bad.
Examining our bounce rate, we see a high rate as “bad” and a low rate as “good”. We inherently classify a page experience in this binary fashion – useful vs. not useful – when the story is far more nuanced than that.
Getting the Whole Story
The first indication that there’s more to Bounce Rate is that it can be easily manipulated. We calculate a bounce as a single-page session where a click is not registered. But no-click visits aren’t necessarily bad experiences.
Consider visitors to your Contact page. Is it a bad experience if they found your address or phone number and took things offline? And what about mobile users who may read through your entire blog post without ever clicking? In both of these examples, the end results were positive interactions that can’t be measured by Bounce Rate alone.
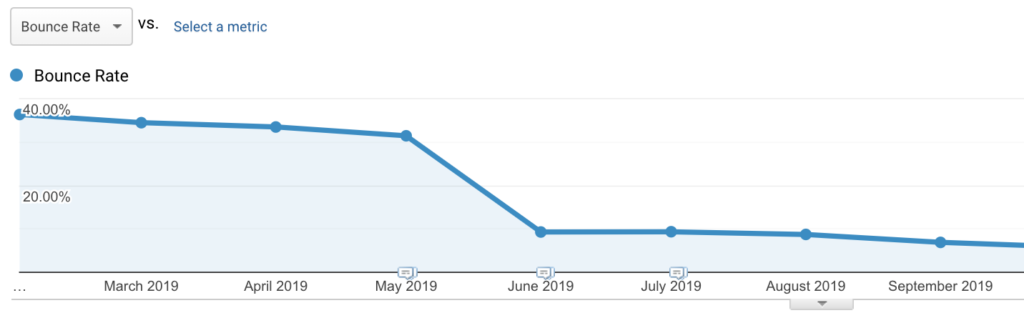
If you want further proof of its irrelevance, then consider the rise of popups and lazy-loading content. If you require users to interact with the page when they arrive with a popup or a “click here to continue reading” CTA, then you can dramatically reduce your bounce rate without changing a thing (see the example below). The fact that it can be so easily manipulated is a sign it can’t be trusted.
gif credit: themuse.com
Time on Page
Conventional wisdom says the more time someone spends on your webpage, the likelier they are to buy from you. So Time on Page would seem to be a natural way to measure how engaging our content is. But in truth, Time on Page can be a misleading metric. This is one area where we run into problems with Google’s tracking.
Google uses the time of the next page view or click to determine the time you spent looking at the current page. So in our blog post example, that session would register a 0:00. The same happens for the last page viewed in a session. If there’s no next page, then time isn’t calculated on the current page.
But wait, there’s more!
If you’re like me and live with an over-abundance of browser tabs, then you may be artificially inflating those pages’ averages. Once that timer starts it doesn’t stop until that session has 30 minutes of inactivity.
It’s these outliers that skew the reporting of Time on Page, making it ineffective.
Exit Pages
To be clear, knowing the exit rate of your pages isn’t an entirely useless metric, but the conclusion it naturally draws you to is not wholly accurate. The assumption with the exit rate metric is that every visit to your website should be a revenue-generating experience. And if those visitors don’t convert then that page failed to do its job. But not all of your visitors are going to convert to a lead or a sale and that’s alright.
The buyer’s journey is long and winding. Visitors can be gathering information or comparing prices. They could be existing customers looking for resources or competitors sourcing ideas. So the premise that if a user leaves your site without converting is incomplete. One way to get more understanding from Exit Rate is to combine it with outbound link click tracking (using Google Tag Manager). This will tell you if users are clicking off of your site to something helpful.
Site Speed
It’s no secret that site speed is a vital part of your website’s performance. Not only in search engines, but it has a drastic impact on revenue. It can make or break a purchase. So why wouldn’t you want to know how each page loads on your website?
The Issue
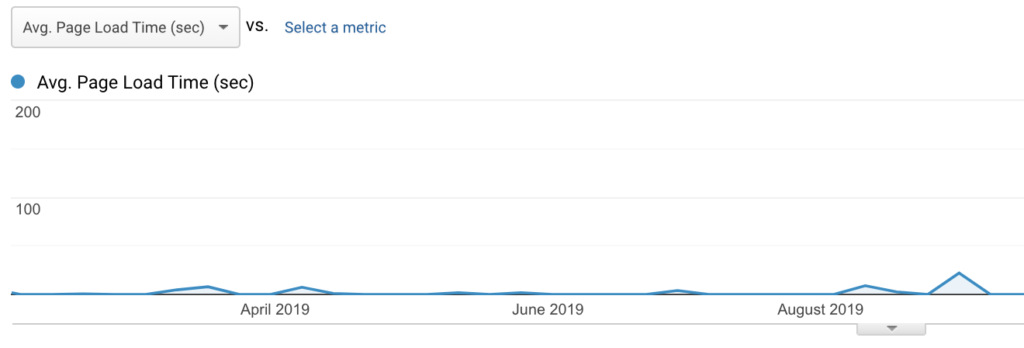
The single biggest issue with GA’s Site Speed data is that it base their findings on only 1% of your traffic. That a small sample size, potentially leaving you to make decisions based on outliers. If your website doesn’t have a lot of daily visitors then outliers are more than likely.
It’s also important to note that these page timings are based on your website’s average speed, so it doesn’t account for how other websites in your space are doing. If you want an accurate report on your webpage timings, you can use Google’s Pagespeed Insights.
The Silver Lining
All of these gaps in collecting data can lead us to draw the wrong conclusions. We want data to be cut and dry, to tell us if what we’re doing is good or bad. But in reality, review data should be on a spectrum, full of exceptions and contradictions.
Data should tell a story not dictate absolutes. When analyzing these metrics use other metrics to validate your hypothesis. Focussing on the wrong metrics can cause you to miss the real opportunities to improve. Understanding these gaps in your analytics will help you to avoid making costly decisions.
When it comes to driving organic traffic, not all SEO strategies are created equal. Applying traditional SEO tactics might not be enough if you’re running an online store.